|
Separation and Detection of Unsaturated Fatty Acid Methyl Esters (UFAMEs)
| Electrospray mass spectrometry (ES-MS) especially in combination with capillary HPLC
(CHPLC) and capillary electrochromatography (CEC) is one of the most powerful techniques
for the structural elucidation of polar bio-polymeres (see also page 85). Unfortunately electrospray ionisation so far is not applicable to non-polar substances and of limited significance for weakly polar substances. Recently a new ionization method adding (by sheath flow technique) a solution of a central ion capable of forming charged coordination compounds has been developed [1, 2].For the hyphenation of CHPLC and CEC to coordination ion spray mass spectrometry (CIS-MS) the coaxial sheath flow interface described by Smith et al. [3] for capillary zone electro-phoresis mass spectrometry (CZE-MS) coupling |
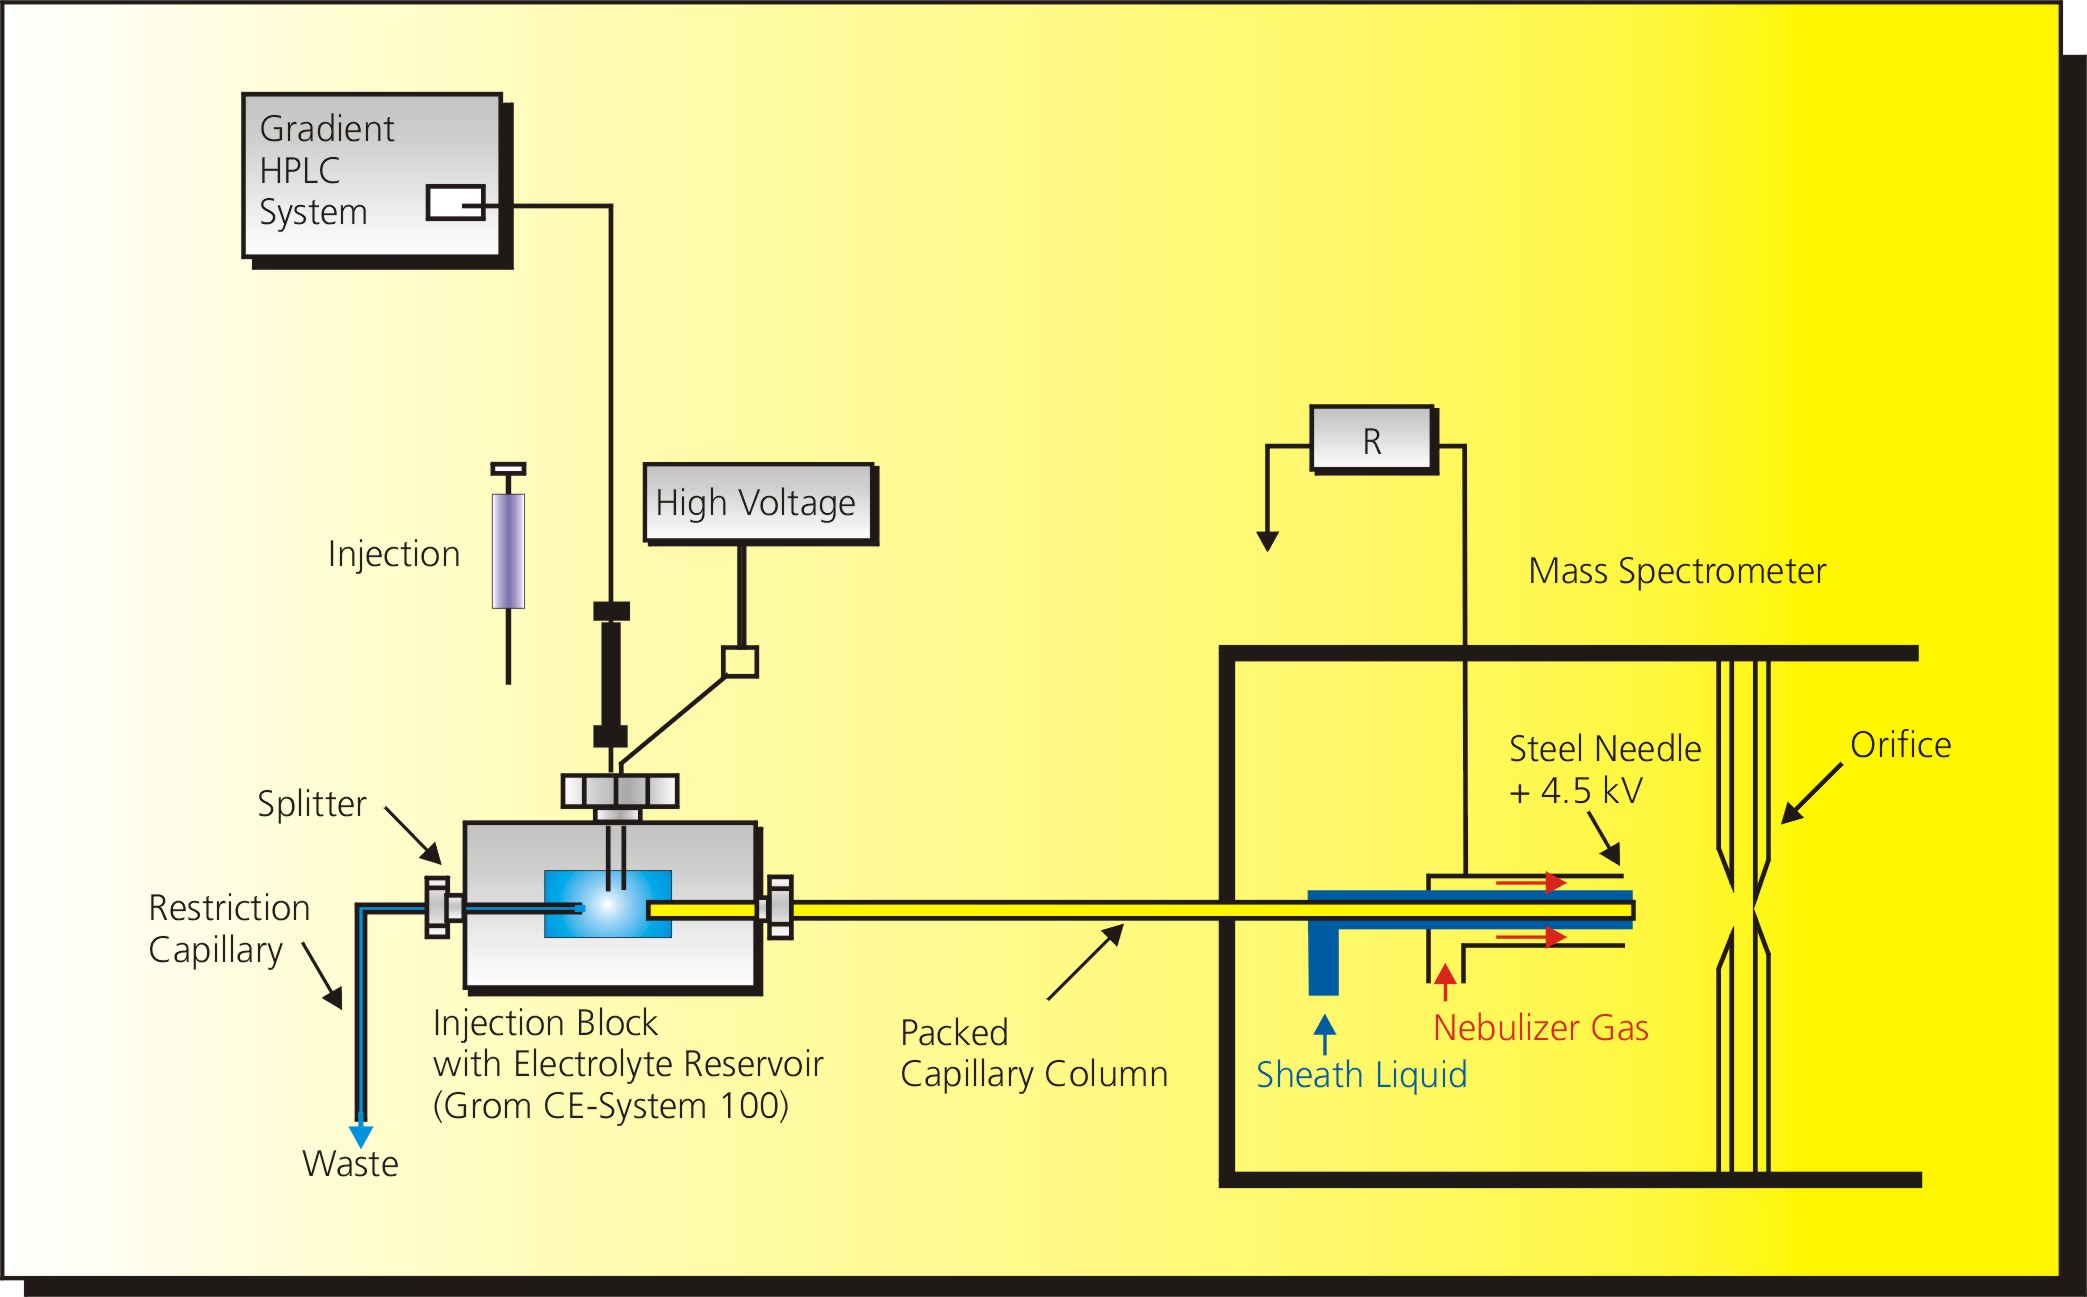
was used . Figure 1 shows a schematic drawing of the setup for CEC- and CHPLC-CIS-MS
coupling. In this arrangement a concentric series of capillaries is used in which the
central CEC/CHPLC column (100 µm i.d., 164 µm o.d.; length 25 cm) is surrounded by a
stainless steel needle and the latter by the nebulizer gas. The coordination ion solution is introduced in the interspace between steel needle and separation column by a syringe pump at a flow rate of 3 µ l/min. T [3] hereby the coordination ion solution is acting as complexing reagent providing ionization as well as sheath flow ensuring stable spray conditions. was utilized for the detection of unsaturated It is well known from coordination chemistry that silver ions have a high affinity for olefinic compounds. This affinity was utilized for the detection of unsaturated fatty acid methyl esters (UFAMEs) by using an aqueous sheath flow containing AgNO3 . |
|
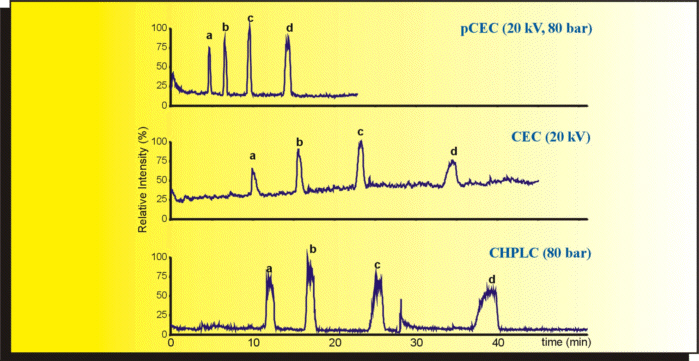
| Figure 2 shows the comparative separations of four UFAMEs with CEC, pressurized with CEC, pressurized CEC (pCEC) and CHPLC with CIS-MS for detection. The reduction of analysis time is relatively small by changing from CHPLC to CEC (10 %). | The combination of pressure and electroosmotic flow (EOF) in pressure CEC (pCEC) however decreases the analysis time by about 60 % and narrows the peaks drastically. | |
|
| Figure 2: Separation of the methyl esters of (a) palmitoleic acid, (b) oleic acid, (c) eicosenoic acid and (d) erucic acid. Column: 100 µm i.d., 164 µm o.d., length 25 cm, packed with GROM-SIL ODS 0-AB, 100 Ĺ, 3 µm. Eluent: 40 mM pH 9 / ACN = 5 / 95. Sheath liquid: 100 µg/ml NH4AC, AgNO3. |
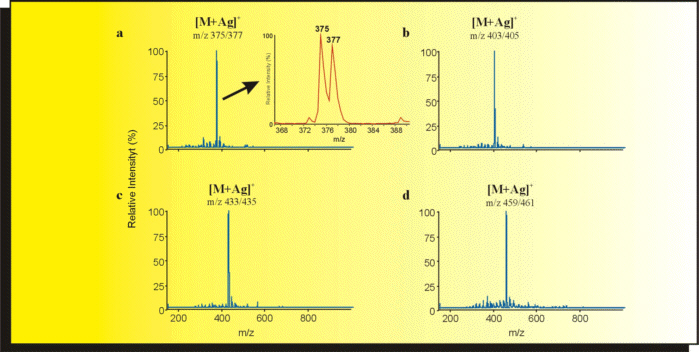 |
| Figure 3: Shows the mass spectra taken from the peaks in figure 2. The Ag+ complexes are readily recognized on account of the characteristic abundance ratio of silver isotopes (107Ag / 109Ag = 51.8 / 48.2). Therefore the magnification shows a double peak for the [M+Ag]+ ions. |
| [1] E. Bayer, P. Gfrörer, C. Rentel, Angew.
Chem. Int. Ed. 38, 992-995 (1999). [2] C. P. Gfrörer, E. Bayer, C. Rentel, Electrophoresis 20, 2329-2336 (1999). [3] R. D. Smith, C. J. Barinaga, H. R. Udseth, Anal. Chem. 60, 1948-1952 (1988). |